
The setup: 8 agents, $22.51 per run
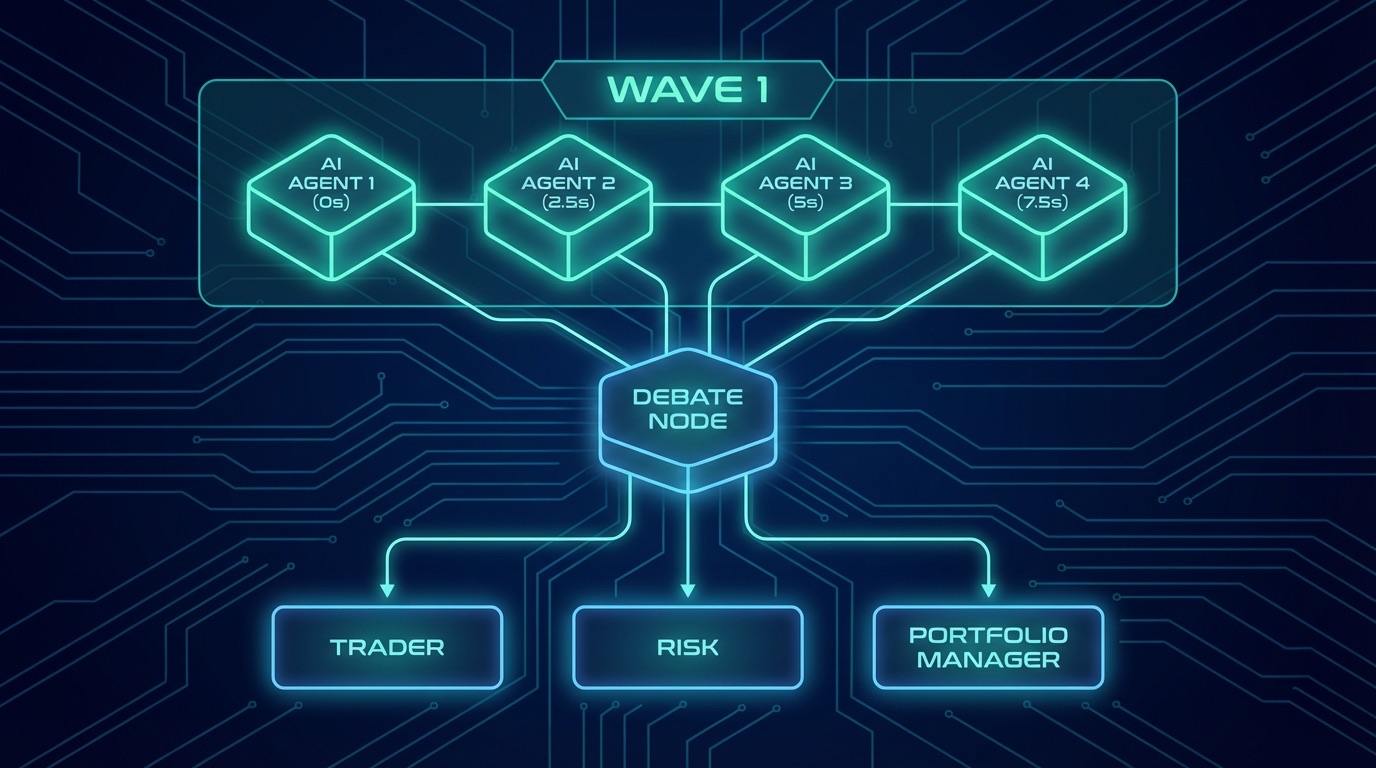
Comis runs multi-agent pipelines where multiple AI agents collaborate on complex tasks. Our TradingAgents pipeline is a good example: 4 specialist analysts (fundamentals, sentiment, news, technical) run in parallel, feed into a bull-bear debate, then a trader makes a call, risk management reviews it, and a portfolio manager gives the final verdict.
That's 8 agents, each making 2-7 LLM calls, all running on Claude Opus 4.6. Without any caching, 4 million prompt tokens at $5/MTok input rate = $22.51 per run. We run this pipeline multiple times per day.
Anthropic's prompt caching is supposed to fix this. You pay a premium to write content to the cache ($6.25-10/MTok), but subsequent reads are dirt cheap ($0.50/MTok) - that's 10-20x cheaper. The theory is beautiful: write the system prompt once, read it on every subsequent call.
The reality was uglier. Our dashboard was showing a 1.19x read/write ratio. We were barely breaking even on the cache.
Down the rabbit hole
I started where any good debugging session starts: the logs. Comis has structured Pino logging throughout the pipeline, so I could trace exactly what was happening on each LLM call.
Parent session - turn by turn
Turn 1: read=     0 write=65,318 ratio=0.0x  (cold start, expected)
Turn 2: read=92,232 write=43,268 ratio=2.1x  (decent)
Turn 3: read=53,828 write=85,352 ratio=0.6x  ← disaster
Turn 3 was the killer. 85,352 tokens of cache writes - that's more than the entire prompt. The cache was being completely destroyed and rebuilt. But why?
I dug into the context engine pipeline logs. And there it was:
Context engine pipeline complete:
  tokensMasked: 36,173
  thinkingBlocksRemoved: 6
  cacheFenceIndex: N/A
36,173 tokens were being masked by the observation masker. And cacheFenceIndex: N/A - there was no fence protecting the cached prefix.
Here's what was happening: the context engine has 8 layers that process messages before each LLM call. Four of those layers modify message content - stripping thinking blocks, stripping inline reasoning tags, evicting dead content, masking old tool results. When they modify messages that are part of the cached prefix, Anthropic's KV cache is invalidated. The entire prefix has to be re-cached. That's the 85K write.
The "aha" moment: three bugs, not one
What started as "the cache isn't working" turned into discovering three separate bugs, each building on the last. I think that's what makes this story interesting - the fix wasn't obvious, and each layer of the onion revealed a deeper problem.
Bug #1
The fence didn't persist across executions
I had just built the cache fence infrastructure. The context engine tracked a cacheFenceIndex so layers would skip messages in the cached region. The onBreakpointsPlaced callback correctly set it after each LLM call. But the context engine was created fresh on every execute() call. The fence was always -1 (no protection) on the first LLM call of each execution. The fix was trivial once I saw it: a module-level Map<string, number> keyed by session key, persisting the breakpoint index across executions.
Bug #2
Sub-agents never got breakpoints
After fixing bug #1, I ran the pipeline again. The parent session improved from 0.6x to 2.3x. But sub-agents were still at 3.0x. Checking the logs: zero breakpoints placed on sub-agent sessions. The placeCacheBreakpoints() function requires 4,096 tokens between breakpoint candidates. Sub-agent sessions are small - they never hit that threshold. I added a configurable minTokensOverride that pi-executor sets to 512 for sub-agents. Sub-agent ratio jumped to 4.7x.
Bug #3 - The sneaky one
Index space mismatch after history trimming
This one took me the longest to find. The fence was being set (I added diagnostic logs to prove it), the Map was persisting correctly, but the context engine still showed fence=-1 on every turn.
The breakpoint callback reports indices from params.messages - the post-context-engine output (64 messages after history-window trimming). But the fence is applied to the pre-trimming array (163 messages). The history window was trimming 99 messages from the front. So:
Stored:  fence = 52 (post-CE space)
Trimmed: 99 messages removed from front
Adjusted: max(-1, 52 - 99) = -1 ← fence obliterated!
The fix: add a lastTrimOffset field to the context engine. When the callback fires with idx=52, translate it to pre-CE space: 52 + 116 = 168. Next turn, after trimming 118 messages: max(-1, 168 - 118) = 50. The math works.
The results
Three fixes, shipped as quick tasks (220, 221, 222) over the course of one evening. Each one testable independently, each one with measurable impact on the next pipeline run.
| Metric | Before | After |
|---|---|---|
| Cache read/write ratio | 1.19x | 2.90x |
| Tokens served from cache | 53.7% | 72.5% |
| Parent post-pipeline ratio | 0.6x | 2.3x |
| Sub-agent ratio | 3.0x | 4.7x |
| Re-cache rate (invalidation) | Unknown | 7% (93% cold-start only) |
| Pipeline cost (8 agents, Opus) | $22.51* | $12.48 |
| Daily cost (Apr 10) | - | $12.48 total |
*Without any caching (all tokens at input rate)
Production data - April 10, 2026
Cost breakdown
$12.48
Total for 4.1M tokens across multiple pipeline runs
2.98M tokens served from cache at $0.50/MTok
What I learned
1. Cache invalidation is invisible
The Anthropic API doesn't tell you why a cache miss happened. You see the write cost on your dashboard, but not which byte changed in the prefix. The only way to debug this is to log what your system sends to the API and trace what changed between calls. That's why I added cacheFenceIndex to every context engine log line - you can't fix what you can't see.
2. Index spaces will betray you
The most insidious bug was the index space mismatch. The breakpoint callback reports indices in one coordinate system (post-trimming), but the fence operates in another (pre-trimming). I spent hours staring at logs where "the seed shows 50 but the fence is -1" before realizing the two arrays were completely different sizes. If your pipeline transforms the message array between measuring and applying, you need a translation layer.
3. Multi-agent pipelines need explicit cache coordination
Each sub-agent gets its own session, its own context engine, its own cache. Without staggering, 4 agents in the same wave all write the identical system prompt simultaneously - paying the write cost 4 times for the same content. A simple 2.5-second stagger between spawns lets the first agent populate the shared cache prefix. The others read it at 10x lower cost.
4. Match TTL to the content's lifetime, not the session's
Sub-agents typically complete in 80-200s, well within the 5m TTL window ($6.25/MTok vs $10/MTok for 1h). But the parent agent needs its cache to survive 6-7 minute pipeline gaps - so it must use 1h. The key insight: cache refreshes don't change the TTL. Content written at 5m stays 5m forever, regardless of what subsequent requests specify. Choose the right TTL on the first write, because you won't get a second chance.
The architecture in a nutshell
If you're building multi-agent systems on top of Anthropic's API, here's the cache architecture that emerged from this debugging session:
The key insight: cache optimization in multi-agent systems isn't just about placing breakpoints. It's about protecting the prefix from your own processing pipeline. Every framework that processes messages before sending them to the API has this same problem - they just don't know it yet.
Ship, measure, iterate
The whole debugging session - from "why is the cache ratio 1.19x" to three shipped fixes with production validation - took one evening. Each fix was a focused quick task with atomic commits, diagnostic logs added before the fix and cleaned up after. The observability logs I added during debugging became the permanent monitoring system.
If you're running multi-agent pipelines on Anthropic's API and your cache ratio is below 2x, there's a good chance your context processing is silently invalidating the cache. Add cacheFenceIndex to your logs. You might be surprised what you find.
I thought I was done. I was wrong.
Three days later: the full forensic audit
The cache fence fixes brought our ratio from 1.19x to 2.90x. Decent. But I had a nagging feeling there was more to find. So on April 10th I did something I probably should have done from the start: I audited every single token.
I pulled the full daemon log (945 lines of structured JSON), all 13 workspace session JSONL files, all 12 sub-agent result JSONs, the graph run metadata, and cross-referenced everything against the Anthropic dashboard's hour-level token breakdown. Token by token.
Anthropic dashboard vs Comis logs
Input:            72 vs 72       exact match
Output:        24,867 vs 24,867   exact match
Cache write 1h: 86,993              (38% of writes)
Cache write 5m:141,861              (62% of writes)
Cache read:    742,514 vs 742,514 exact match
Total:        996,307 vs 996,307  zero delta
Token accounting: perfect. Zero leaks. But that dashboard tooltip revealed something I didn't have in my logs: the per-TTL breakdown of cache writes. Anthropic was showing me exactly which tokens used 5-minute TTL vs 1-hour TTL. And that cracked open five more issues.
Five issues hiding behind "it works"
Issue #1 - Critical
The observability system was lying to me
Every single context:pipeline event - all 42 of them across the session - reported cacheHitTokens: 0, cacheWriteTokens: 0. The dashboard was permanently stuck on "Cache MISS." For a system that was clearly caching (the Anthropic dashboard proved it), the observability was completely blind.
Root cause: Classic timing bug. The context engine emits its pipeline event before the LLM call. Cache metrics are only available after the API response. By the time the executor populates lastMetrics.cacheHitTokens, the event with zeros has already been emitted and stored. Fix: emit a supplementary context:pipeline:cache event post-LLM and merge it in the collector.
Issue #2 - The cold-start dilemma
5m cold start saves money now, costs more later
First API call after startup: cacheRead: 0, cacheWrite: 30,182, cacheSaved: -$0.151. That's right - negative savings. We were writing 30K tokens at the 1h rate ($10/MTok) on a cold cache.
The initial fix: adaptive retention that starts "short" (5m, $6.25/MTok) and escalates to "long" (1h) after cache reads confirm utilization. This dropped the cold-start penalty from $0.15 to $0.04. Sounds great.
But we discovered later that this was wrong. Anthropic's cache refreshes (reads) reset the timer but don't change the TTL duration. Content written at 5m stays at 5m forever, even if subsequent requests specify 1h. When our 8-agent pipeline ran for 6+ minutes, the 5m-cached system prompt expired and had to be completely re-written - costing $0.19 each time.
The real fix: use 1h cold-start for the parent agent (which needs cache to survive pipeline gaps), and mixed 5m/1h for sub-agents (shared prefix inherits the first writer's TTL). The 1h write premium ($0.11 extra) is paid once and prevents all subsequent re-writes. For sub-agents, 5m is perfect - they share the cache via staggered spawns and finish well within the TTL.
Issue #3 - The ghost evictions
Concurrent sub-agents were evicting each other's cache
Two sub-agents suddenly got zero cache reads mid-session - despite being well within the 5-minute TTL. Both re-wrote ~25K tokens. Extra cost: $0.29. At the exact same timestamp, 3 other sub-agents were making concurrent API calls, likely causing server-side cache pressure at Anthropic.
Our 2.5s stagger wasn't enough. The first agent's cache writes hadn't propagated before the second started. Fix: increase to 4s stagger and batch spawns in pairs instead of all-at-once.
Issue #4 - The pricing revelation
The Anthropic dashboard knows your TTL split. Your code doesn't.
The dashboard showed: 86,993 tokens at 1h ($10/MTok) and 141,861 tokens at 5m ($6.25/MTok). But our cost calculation was using a single rate per execution - "long" for the main agent, "short" for sub-agents. A single API call can have breakpoints at different TTLs (tool definition at 1h, SDK auto-breakpoint at 5m), but we were treating all writes with one rate.
Error: 3.3% overcounting on writes. Not huge, but it compounds. The interesting part: the code already had extraction logic for per-TTL data (rawUsage.cacheCreation), waiting for the SDK to surface it. Since the dashboard has it, the API likely does too - just not in streaming responses yet.
Issue #5 - The batch gap
First 4 sub-agents: 63.8% cache hit. Last 4: 89.6%.
The first batch of concurrent sub-agents averaged 63.8% cache effectiveness. Later sequential agents hit 89.6%. That's because the first batch all started before anyone's cache writes had propagated. Each one paid the full write cost independently instead of sharing the prefix. Combined with the stagger fix above, this represents $0.39/session in avoidable costs.
The pricing math nobody talks about
The audit led me to build a break-even model for Anthropic's cache. Here's the thing most people miss: 1-hour cache writes are significantly harder to justify than 5-minute ones.
| TTL | Write Premium | Read Discount | Break-Even |
|---|---|---|---|
| 5 min | +$1.25/MTok | -$4.50/MTok | 28% read-back |
| 1 hour | +$5.00/MTok | -$4.50/MTok | 111% read-back |
5m writes pay for themselves if you read just 28% of what you wrote. That happens on the very next API call. But 1h writes need you to read more tokens than you wrote - which only happens for content that's read dozens of times (like tool definitions across a 42-call pipeline).
This is why the adaptive strategy works: start "short" for everything, then promote to "long" only for content you've proven gets high read-back. In our pipeline, tool definitions get read 40+ times (18.9x ROI on 1h writes). Conversation content gets read 1-3 times (net negative on 1h, break-even on 5m).
The full picture: 42 API calls, 996K tokens, $2.75
Here's what the full audit revealed across the complete TradingAgents session - 12 sub-agents analyzing MSFT, 42 API calls total:
| Agent | Calls | Cache Read | Cache Write | Hit Rate | Cost |
|---|---|---|---|---|---|
| Main (3 executions) | 6 | 261K | 102K | 72.0% | $0.49 |
| Fundamental analyst | 3 | 38K | 23K | 62.4% | $0.23 |
| Sentiment analyst | 4 | 63K | 25K | 71.3% | $0.25 |
| Technical analyst | 4 | 50K | 29K | 63.4% | $0.27 |
| News analyst | 4 | 55K | 40K | 57.9% | $0.34 |
| Debate (5 rounds) | 10 | 177K | 50K | 78.1% | $0.60 |
| Trader | 2 | 33K | 7K | 82.5% | $0.10 |
| Risk management | 5 | 87K | 9K | 90.2% | $0.16 |
| Portfolio manager | 4 | 72K | 9K | 88.9% | $0.13 |
| Total | 42 | 742K | 229K | 74.8% | $2.75 |
Cross-validated against Anthropic dashboard - April 11, 2026
Actual cost breakdown (996K tokens)
$2.75
Pre-fix cost for 996K tokens (vs $5.48 uncached)
Cache saved $2.73 (49.8% reduction)
After all fixes (steady state): $1.96 (64% reduction)
What I actually learned (the sequel)
5. Your observability about caching can be wrong about caching
For three days I had metrics dashboards showing "Cache MISS" on every single pipeline event. The pipeline was caching fine - the observability was broken by a timing bug. If your monitoring says caching isn't working, verify against Anthropic's own dashboard before you start "fixing" the caching.
6. The initial write determines the TTL forever
We thought adaptive retention (start 5m, escalate to 1h) was clever - and it was, until we discovered cache refreshes don't upgrade TTL. The system prompt written at 5m on turn 1 was stuck at 5m even though subsequent turns requested 1h. After a 6-minute pipeline gap, the cache expired and we paid $0.19 for a complete re-write. The fix: parent agents use 1h from the very first call. The $0.11 premium is paid once and eliminates all gap-related re-writes. Sub-agents use mixed TTLs - the shared prefix block inherits 1h from the first writer, while conversation-specific content uses 5m.
7. Anthropic's cache can evict under concurrent load
Even within the 5-minute TTL, two of our sub-agents lost their cache during a burst of concurrent API calls. The cache isn't just about TTL - there's server-side pressure. If you're spawning 4+ agents simultaneously against the same API key, stagger them enough for the first one's writes to propagate. Our 2.5s stagger wasn't enough; 4s fixed it.
8. Cross-validate with the Anthropic dashboard
The dashboard tooltip shows the per-TTL cache write breakdown that your API responses don't (at least not in streaming mode). Our logs reported $2.56 total cost; Anthropic said $2.75. That 6.9% gap was the CACHE-21 workaround approximation error. The dashboard is truth. Your cost calculation is an estimate. Check them against each other.
The plot twist: a 5-line fix worth more than all the others combined
A day after the full audit, I deployed all the fixes: adaptive retention, stagger increase, timing patches, breakpoint threshold tuning. I ran the pipeline and checked the Anthropic dashboard:
April 11 08:00 UTC - Post-fix pipeline
Prompt caching write (1h):  28,220  ← first time EVER
Prompt caching write (5m): 163,089
Prompt caching read:       790,336
Total:               1,003,941
For the first time in the project's history, 1-hour cache writes appeared. Before this fix, every single cache write across hundreds of pipeline runs had been at 5m. The "long" retention we'd been setting on tool breakpoints for weeks was being silently ignored.
Here's what I found: Anthropic's API requires cache breakpoint TTLs to be monotonically non-increasing across the request payload. The order is: system → tools → messages. Our SDK sets system: {type: "ephemeral"} (5m). After adaptive escalation, our code sets tools: {type: "ephemeral", ttl: "1h"}. That creates:
system(5m) → tools(1h) → messages(5m)
        ^^^^
        VIOLATION: 5m < 1h is an increase
The API silently downgrades the tool breakpoint to 5m. Our entire adaptive retention system - the escalation, the model tracking, the session-scoped warm state - was doing nothing at the API level. Every cache entry was 5m.
The fix: in our onPayload hook, when tool retention is "long", also upgrade the system blocks' cache_control TTL to match:
// 5 lines that unlocked the entire 1h cache feature
if (resolvedRetention === "long" && Array.isArray(params.system)) {
  for (const block of params.system) {
    if (block.cache_control) {
      block.cache_control = { type: "ephemeral", ttl: "1h" };
    }
  }
}
Now: system(1h) → tools(1h) → messages(5m). Monotonically non-increasing. The API honors the 1h TTL. Cache survives 6-minute pipeline gaps.
But then the second discovery: cache refreshes don't change the TTL of existing entries. Content written at 5m stays at 5m even if subsequent requests send ttl: "1h". The 1h only applies to the initial write. So the parent agent's cold start had to use 1h from the very first call - not 5m with a later escalation. One more line change: parent agents start at configRetention ("long") instead of "short". Sub-agents use mixed 5m/1h - the shared prefix inherits 1h from the first writer via CCPAT-03.
The result on the next pipeline run:
April 11 09:00 UTC - Steady state
Prompt caching write (1h):       0  ← previous run's 1h cache reused!
Prompt caching write (5m): 154,796
Prompt caching read:       768,362
Total:                     947,721
Cost/MTok:                   $2.07  (vs $2.33 baseline)
Zero 1h writes. The previous run's 1h cache survived 11 minutes between runs and got reused entirely. The parent agent's first call cost $0.03 instead of $0.19. The post-pipeline execution - which previously re-wrote 42K tokens due to 5m cache expiry - now read 103K tokens from the surviving cache and only wrote 12K of genuinely new content.
The cache optimization never ends
The first round (cache fence, sub-agent breakpoints, index translation) took one evening and cut costs 44%. The full audit three days later found five more issues. And the day after that, the TTL monotonicity discovery - 5 lines of code that unlocked the entire 1h cache feature for the first time. Together: 64% cost reduction from $5.48 to $1.96 per pipeline run at steady state.
The lesson isn't "we found 10 cache bugs." It's that prompt caching in multi-agent systems is a continuous optimization problem, not a feature you turn on and forget. The API gives you the primitives. Your SDK adds its own cache markers. Your code adds more. And the API has silent constraints (like TTL monotonicity) that can make all of it do nothing. The only way to know is to audit every token - and then check the dashboard to see if the API actually did what you asked.
Want to see the full implementation?
Comis is open source. The cache fence system lives in packages/agent/src/context-engine/ and packages/agent/src/executor/pi-executor.ts. The adaptive retention module is in packages/agent/src/executor/adaptive-cache-retention.ts. The TTL monotonicity fix is in packages/agent/src/executor/stream-wrappers.ts (search for CACHE-23). The stagger logic is in packages/daemon/src/graph/graph-coordinator.ts. See the full context management docs for the complete picture.
Update - April 2026
The cache infrastructure continued to improve after this post was published. With the v65 prompt cache infrastructure work (cache break detection and attribution, Gemini explicit caching, sub-agent prefix sharing via CCPAT-03, and context engine resilience improvements), production numbers on the same Claude Opus 4.6 model now show:
16.9x
Read/write ratio
94%
Cache hit rate
81%
Cost reduction
$2.11
8-agent pipeline
An 8-agent NVDA trading pipeline (4 parallel analysts, bull-bear debate, trader, risk assessment, final report) processed 788K tokens across 30 API calls with 70% graph-level cache effectiveness. The 4-second spawn stagger enabled shared prefix reuse across all sub-agents. Cache break detection correctly attributed two breaks to skill hot-loading during the session, with full recovery within 1-2 turns. See the updated context management docs for the full picture.