
The prompt: one sentence, taken literally
Comis's README has a marketing line that sounds like exactly the kind of thing you should be skeptical of:
"Have four analysts research NVDA in parallel, then run a bull vs bear debate, and let the head trader make the final call." → One sentence creates a 7-node DAG pipeline with parallel fan-out, multi-round debate, and synthesis. No YAML, no scripting.
I sent that exact sentence to my running daemon via the OpenAI-compatible /v1/chat/completions endpoint. 27 seconds later the API call returned. In that 27 seconds the agent didn't write a report. It wrote a graph.
{
  "id": "stock-deep-dive",
  "label": "Deep Stock Analysis: Parallel Analysts → Debate → Final Call",
  "nodes": [
    {"node_id": "technical",   "task": "You are a technical analyst..."},
    {"node_id": "fundamental", "task": "You are a fundamental analyst..."},
    {"node_id": "sentiment",   "task": "You are a sentiment/news analyst..."},
    {"node_id": "macro",       "task": "You are a macro analyst..."},
    {"node_id": "debate",      "task": "Bull vs bear synthesis...",       "depends_on": ["technical","fundamental","sentiment","macro"]},
    {"node_id": "head_trader", "task": "Final call with entry plan...",   "depends_on": ["debate"]}
  ]
}
Then it called pipeline.execute({"id":"stock-deep-dive","variables":{"TICKER":"NVDA"}}), the daemon spawned six sub-agents, and returned a Telegram-style "Pipeline is live ⚡️" acknowledgement to me. That was the chat-API call - done. The actual research was happening in the background, on six separate session keys.
What the agent actually built
The shape isn't novel. What's interesting is that the LLM produced it from one sentence, including correct dependency ordering, sensible max_steps budgets, and parameterizable variables (so the same pipeline reruns on AAPL, TSLA, MSFT - no second prompt).
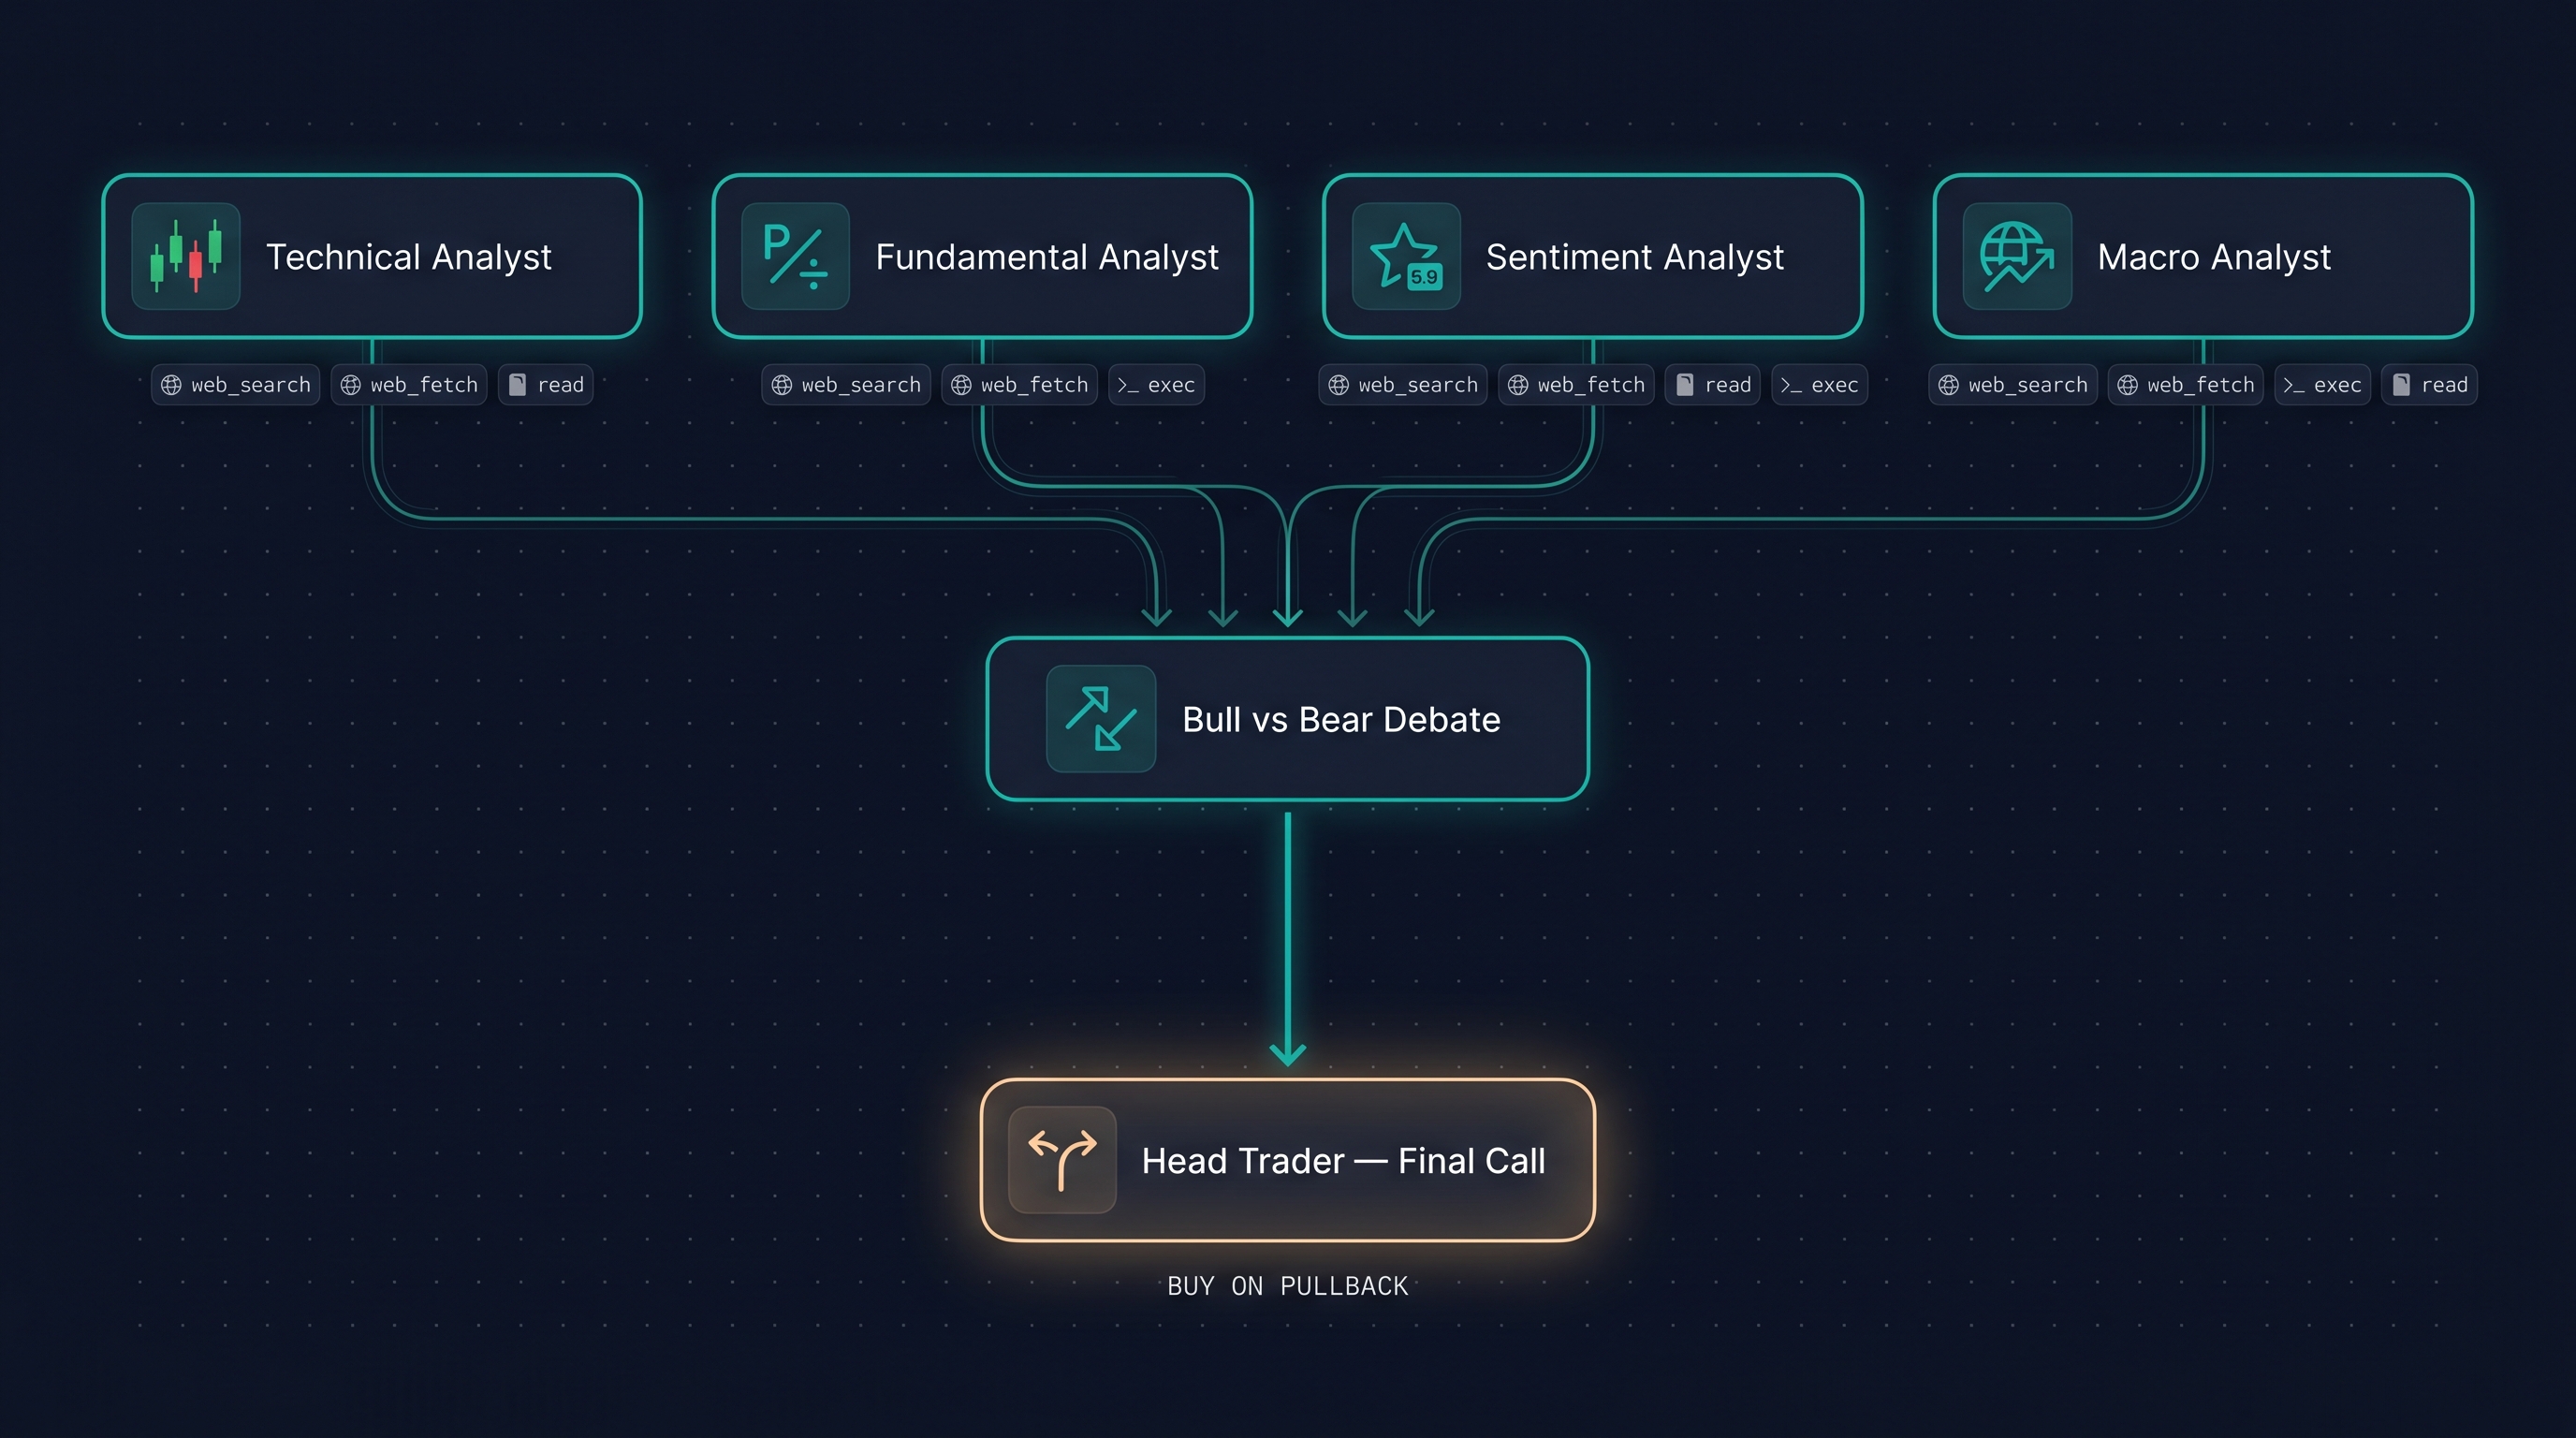
Four analysts at the top fan out in parallel. Each runs in its own sub-agent session - separate memory, separate workspace, separate tool budget. They converge into a debate node that reads all four outputs and runs a multi-round bull-vs-bear synthesis. The debate output flows into a head-trader node that produces the final actionable call.
Each box on that diagram became a real subagent in the daemon log:
sub-agent-1903d99a-...   technical analyst
sub-agent-195c0701-...   fundamental analyst
sub-agent-6fb4128e-...   sentiment analyst
sub-agent-f7d0e988-...   macro analyst         (the heavy lifter - see below)
sub-agent-7badeca0-...   bull vs bear debate
sub-agent-d3f829c9-...   head trader
Why each box is its own sub-agent (and why that matters)
A sub-agent in Comis isn't a function call. It's a whole new agent session with:
- Its own session key -
default:sub-agent-f7d0e988-...:sub-agent:f7d0e988-...- completely isolated from the parent's conversation history. - Its own context window, with system prompt, tool descriptions, and the analyst's task injected at boot. Nothing else.
- Its own tool budget -
max_steps: 40per analyst, set by the parent at pipeline construction. - Its own workspace for in-flight tool ops, at
~/.comis/workspace/sessions/default/sub-agent@<id>/. Final node output (the analyst's markdown summary) lands one level up in~/.comis/graph-runs/<graph-id>/<node-id>-output.md, alongside a_run-metadata.jsonwith per-node stats.
Why this matters: when four analysts run in parallel, none of them has to wade through the others' search results. The fundamental analyst doesn't see the technical analyst's RSI calculations clogging its context. They each get a clean window to do focused research, then return one coherent summary that flows downstream. The aggregator (debate node) reads all four summaries, not all four conversations.
Without isolation, four parallel analysts would either share one polluted context (token bloat, cross-contamination) or be sequential (no actual parallelism). With isolation, you get fan-out that scales linearly in wall-clock time and degrades gracefully if one analyst times out.
Inside the macro analyst: 34 tool calls
One sub-agent did the heavy lifting. The macro analyst made 34 tool calls across 21 LLM turns over 128 seconds - more than a third of the total session activity. That's the right shape: macro research means a lot of independent threads to chase, and the parallel-isolation lets this sub-agent grind through them without slowing the others down.
Tool calls it actually fired (from the daemon log):
web_search   "NVDA Nvidia stock macroeconomic outlook 2026 interest rates"
web_search   "AI spending chip demand 2026 Nvidia competition sector trends"
web_search   "US trade policy tariffs semiconductors China 2026 Nvidia"
web_search   "Fed monetary policy rate cuts 2026 tech stocks impact"
web_search   "TSMC capacity AI chip supply 2026"
web_fetch    https://www.chartmill.com/stock/quote/NVDA/...
web_fetch    https://altindex.com/ticker/nvda/...
web_search   "Nvidia competitive position AI chips market share AMD 2026"
web_search   "hyperscaler capex 2026 cloud infrastructure spend"
... (25 more)
The analyst pulled real numbers - $700B hyperscaler AI capex in 2026, Fed near-neutral, GDP at 2.2-2.4%, the $5.5B export-control charge, semiconductor revenue crossing $1.3T - and folded them into a "moderately bullish" outlook with specific risk flags (tariff escalation could shave 0.5-1% from GDP). Not regurgitated training data; live web research with the source URLs in the tool-result files.
Across all six sub-agents, the tool-call distribution looked like this:
| Tool | Calls | Use |
|---|---|---|
| web_search | 43 | research queries (Brave, Tavily, Perplexity) |
| web_fetch | 21 | scraping analysis sites + earnings filings |
| read | 10 | sub-agents reading their own tool-result files |
| exec | 8 | shell ops in the agent workspace |
| pipeline | 2 | pipeline.save + pipeline.execute |
| memory_tool | 1 | agent autonomously stored a user fact |
| ls | 1 | workspace introspection |
| grep | 1 | text search |
| total | 87 | across the six pipeline sub-agents (101 including the parent orchestration calls) |
Two of those 101 tool calls failed (a 2% failure rate - typical noise from exec shell ops). Both were caught by the runtime and the agent recovered without aborting. No retries needed at the orchestration layer.
The debate node: zero tools, pure synthesis
The bull-vs-bear debate node is the strangest sub-agent in the run. Zero tool calls. One LLM call. 76 seconds. finishReason: stop.
Why? Because by the time the debate node runs, the four analysts have already done all the research. They each wrote a markdown summary to disk. The debate node's task isn't to research more; it's to argue from the existing material, weighing strengths and surfacing contradictions. That's a pure-reasoning job. Calling more web tools would just dilute it.
The output it produced:
- PEG under 0.4 - paying a value multiple for hypergrowth
- $700B AI capex supercycle, Blackwell supply-constrained
- CUDA moat deepening - $97B FCF, 80% share, fortress balance sheet
- Every analyst Strong Buy, consensus PT $266 (+28%)
- $5T market cap pricing in perfection - one stumble = massive drawdown (beta 2.34)
- Every single insider selling aggressively, zero buying
- AI capex could prove cyclical (like crypto mining), not secular (like cloud)
- Export controls, tariff escalation, hyperscaler custom silicon all chip at the moat
- Growth decelerating: 100% → 65% → 31% by FY2028
That's a useful structure. The model didn't pick a side; it surfaced the actual disagreement and let the next node resolve it. Comis's tool policy left the debate sub-agent with read-only access to upstream tool-result files - it could see what the analysts found, but not run new searches. That constraint was set at pipeline construction, not handed to the LLM as an instruction.
Head trader's call
Five tool calls in this sub-agent - all reads, pulling the four analyst summaries and the debate document. Three LLM calls, 45 seconds. The output:
NVDA is the most dominant tech franchise of this decade - 80% AI share, 73% revenue growth, $97B FCF, forward P/E 25x. But it's overbought at $208 against $212 resistance with every insider selling. Buy the dip on a generational compounder - don't chase into resistance.
| Tranche | Allocation | Price | Rationale |
|---|---|---|---|
| 1 (starter) | 30% | $208 | skin in the game if it breaks out |
| 2 (core) | 40% | $190-196 | 20-day SMA / high-probability entry |
| 3 (gift) | 30% | $183-186 | 50/200-day SMA cluster |
$310-325 (18mo bull)
(below 200-day SMA)
Note: not investment advice. The point isn't that the call was right; the point is that the agent did the work. Real prices ($208.27, +4.32% Apr 24). Real fundamentals ($215.9B FY2026 revenue). Real insider data (Ajay Puri sold $109M in March; Kress, Stevens, Huang all selling on 10b5-1 plans; zero buying). Real macro context. A coherent synthesis. A concrete plan with stops and tranches and a defensible R/R.
None of that is in Claude Opus 4.6's training data - the prices are from yesterday. Every number above came from a tool call.
The numbers
Here's the per-sub-agent breakdown for the run, pulled straight from the daemon's "Execution complete" events:
| Sub-agent | Tools | LLM calls | Duration | Cache hit |
|---|---|---|---|---|
| Technical analyst | 8 | 5 | 46s | 100% |
| Fundamental analyst | 11 | 6 | 65s | 100% |
| Sentiment analyst | 19 | 9 | 74s | 100% |
| Macro analyst | 34 | 21 | 128s | 100% |
| Bull vs bear debate | 0 | 1 | 76s | 100% |
| Head trader | 5 | 3 | 45s | 100% |
| Pipeline subtotal | 77 | 45 | 434s | 100% |
Add the parent orchestration call and a few smaller bookkeeping calls for chat overhead, and the run rolled up to 15 Execution events across about 9.8 minutes of total compute time. Every sub-agent's system prompt and tool-description pack was a 100% cache hit after the first call - the staggered spawn strategy lets all six share the parent's prompt-cache prefix instead of each one writing a fresh cache.
6
sub-agents
101
tool calls
100%
cache hit rate
0
errors / fatals
What had to be working under the hood
Three weeks ago this exact prompt would have failed silently. The agent would have produced a long, well-formatted text response that described what an NVDA pipeline would do, complete with fake-but-plausible numbers it made up from training data, possibly emitting <tool_call>...</tool_call> markup as plain text. toolCalls=0 across the board. Theatre.
The difference is one line of code in pi-executor.ts:
- tools: [],
+ tools: mergedCustomTools.map((t) => t.name),
The pi-coding-agent SDK's tools field is an allowlist of tool names, not a list of definitions. An empty array is treated as a non-empty allowlist that allows zero tools - including all customTools - and every Comis tool got filtered out of the SDK's registry. The Anthropic API request went out with no tools: [...] parameter, the model had no structured way to invoke anything, and you got plaintext markup back. Universal: chat API, Telegram, Discord, every entry point.
Passing the customTool names as the explicit allowlist lands every tool in the registry, filters out conflicting SDK built-ins like bash (Comis registers exec instead, with sandbox + audit hooks), and lets Comis's customTools override built-ins for shared names like read/edit/write. The SDK gets a populated registry, the Anthropic API gets the structured tool array, the model produces tool_use content blocks, and the runtime executes them. The pipeline you saw above is the immediate downstream consequence.
Two regression tests assert the fix in pi-executor.test.ts:
"passes customTool names as the SDK's tools allowlist"- confirms the array is populated."does NOT pass an empty tools allowlist when customTools is non-empty"- explicit guard against re-introducing the bug.
The pattern: orchestration as an emergent capability
Comis didn't ship a "TradingAgents" feature. It ships a pipeline tool that takes a JSON DAG description, a set of platform-level capabilities (sub-agent spawning, sub-agent isolation, tool-result persistence, multi-channel delivery), and lets the LLM compose them.
The model invented "stock-deep-dive" as a graph ID, decided that 4 analysts was the right fan-out width, picked which dimensions were worth analyzing (technical, fundamental, sentiment, macro - not "earnings, options flow, dark pool, lunar phase"), set max_steps: 40 as a sane budget per analyst, parameterized the ticker so the same pipeline reruns on AAPL, parameterized the sub-agent task prompts to encode the analyst persona inline, and ordered dependencies correctly. None of that was hardcoded. None of it required me to write any YAML.
The platform side is small. Six things make it work end-to-end:
- A graph runtime that takes the DAG description, computes the dependency order, dispatches independent nodes in parallel via the daemon's task scheduler, and resolves results downstream.
- Sub-agent sessions with isolated context, isolated memory, and isolated workspace directories.
- A staggered spawn strategy that delays parallel sub-agent boot by ~1-4 seconds each so they share the parent's prompt-cache prefix instead of each one writing a fresh cache (this is what got the 100% hit rate; it's the main idea in the cache optimization post).
- A tool-result persistence layer that writes each sub-agent's output to disk so downstream nodes (and the parent) can read it without holding everything in context.
- A real prompt-cache implementation - every sub-agent inherits the parent's cached prompt prefix, so the system prompt and tool-description pack are written once and read by all six. 100% cache hit rate after the first call across the whole run.
- A working tool-use API integration - the bug the SDK fix resolved, without which none of the above produces structured tool calls.
Try it on your own ticker
If you've connected your Comis daemon to Telegram, this is a one-message interaction. Open your bot's chat and send:
Have four analysts research <YOUR-TICKER> in parallel, then run a bull vs bear debate, and let the head trader make the final call.
That's it. Within seconds the bot replies with a "Pipeline is live ⚡️" acknowledgement and the ASCII diagram of the DAG. Then six sub-agents fan out and go to work in the background. Five to ten minutes later the bot pushes the full report back into the same chat - the four analyst summaries, the bull/bear debate, and the head trader's call - because the Telegram chat is the announce channel for that graph.
The first invocation has to write the prompt cache from scratch on the parent and on each new sub-agent. Every subsequent ticker on the same daemon instance hits the cache for the entire pipeline scaffold and runs noticeably faster. The daemon also saves the stock-deep-dive graph definition, so on the second invocation the agent doesn't even need to redesign the DAG - it dispatches the saved one.
Same prompt works through any channel Comis is connected to: Telegram, Discord, Slack, the dashboard. The chat that received the prompt receives the report. Same DAG. Same six sub-agents. Same isolation.
Run summary
15
Execution events
101
Tool calls fired
78
LLM calls
~9.8 min
Total compute time
64
Web searches fired
0
Errors / fatals